
Building your first prediction model is an exciting way to dive into the world of machine learning and data science. It’s not just about crunching numbers; it’s about uncovering patterns, generating insights, and solving real-world problems. In this tutorial, we’ll guide you through creating a prediction model for house prices, using easy-to-follow steps tailored for beginners.
By the end of this project, you’ll understand the fundamentals of data preparation, model training, and evaluation, and have your first working model to show for it.
What Is a Prediction Model for House Prices?
A prediction model for house prices estimates the price of a house based on various factors such as size, location, and number of bedrooms. These models are widely used in real estate for market analysis and forecasting trends. Here’s a breakdown of the process:
- Dataset selection: Collect data on house features and their respective prices.
- Data preprocessing: Clean and prepare the data for analysis.
- Model training: Use machine learning algorithms to learn patterns in the data.
- Evaluation: Assess the model’s accuracy and make improvements as needed.
Why Create a Prediction Model for House Prices?
Creating a house price prediction model offers:
- Practical Learning: Apply theoretical concepts of machine learning to a hands-on project.
- Real-World Use Case: Explore a common business application used in real estate and finance.
- Beginner-Friendly Approach: Work with straightforward datasets and algorithms to build confidence.
See: House Prices Prediction using Linear Regression Model – Around Data Science
How to Create Your First Prediction Model for House Prices
Step 1: Choose a Dataset
The first step is selecting a relevant dataset. Use datasets from platforms like Kaggle or the UCI Machine Learning Repository. Look for datasets with features like:
- Square footage
- Number of bedrooms
- Location
- Price
For example, the “Ames Housing Dataset” from Kaggle is an excellent choice for beginners.
Step 2: Preprocess the Data
Handle Missing Values
Data often contains missing or inconsistent values. Address these by:
- Removing rows with missing values.
- Imputing missing values using techniques like mean, median, or mode substitution.
Normalize the Data
Features like price and square footage may have vastly different scales. Normalize these to bring them within a similar range, ensuring all features contribute equally to the model.
Split the Dataset
Divide your data into training and testing sets:
- Training set: 70-80% of the data, used to train the model.
- Testing set: 20-30% of the data, used to evaluate model performance on unseen data.
Step 3: Train the Model
Choose an Algorithm
Start with a simple algorithm like linear regression. It’s easy to understand and implement, making it perfect for beginners.
Set Up the Environment
Install Python libraries for machine learning:
pip install pandas scikit-learn
Load the Data
Load your dataset using Pandas:
python
import pandas as pd
data = pd.read_csv('house_prices.csv')
Prepare Features and Target Variable
Separate your features (independent variables) and target variable (dependent variable):
python
X = data[['Gr Liv Area', 'Bedroom AbvGr', 'Neighborhood']]
y = data['SalePrice']
PS: Gr Liv Area represents the above-ground living area in square feet, which directly corresponds to the square footage of the house.
However, note that Neighborhood is a categorical variable and needs to be encoded (e.g., using one-hot encoding) before being used in a machine learning model. Here’s how to do:
X = pd.get_dummies(X, columns=['Neighborhood'], drop_first=True)
Bedroom AbvGr specifies the number of bedrooms above ground level, which is a direct match for the number of bedrooms.
Neighborhood describes the physical location of the property, grouped into various neighborhoods. It represents the location aspect of the dataset.
Split the Data
Divide the data into training and testing sets:
python
from sklearn.model_selection import train_test_split
X_train, X_test, y_train, y_test = train_test_split(X, y, test_size=0.2, random_state=42)
Train the Model
Train a linear regression model:
python
from sklearn.linear_model import LinearRegression
model = LinearRegression()
model.fit(X_train, y_train)
Step 4: Evaluate the Model
Make Predictions
Use the model to predict house prices:
python
y_pred = model.predict(X_test)
Measure Accuracy
Once the model is trained, it’s essential to evaluate its performance on the testing data. This step helps you understand how well the model is likely to perform on new, unseen data.
Evaluate the model using Mean Squared Error (MSE), which measures the average of the squares of the errors, that is, the average squared difference between the predicted and actual values:
python
from sklearn.metrics import mean_squared_error
mse = mean_squared_error(y_test, y_pred)
print(f'Mean Squared Error: {mse}')
3 Bonus Tips for Creating Prediction Models
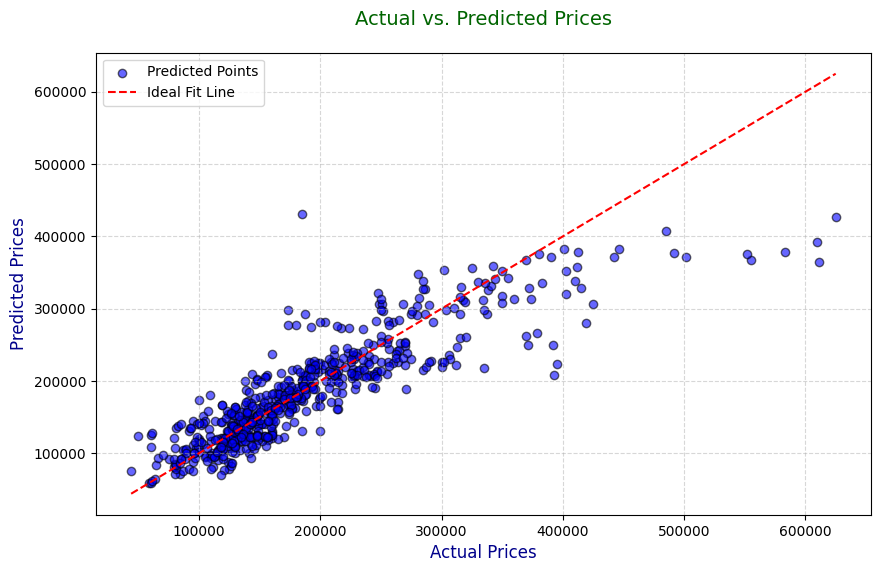
- Visualize Results: Use scatter plots to compare actual vs. predicted prices:
plt.figure(figsize=(10, 6))
plt.scatter(y_test, y_pred, color=’blue’, alpha=0.6, edgecolors=’k’, label=’Predicted Points’)
plt.plot([min(y_test), max(y_test)], [min(y_test), max(y_test)], color=’red’, linestyle=’–‘, label=’Ideal Fit Line’)
plt.xlabel(‘Actual Prices’, fontsize=12, color=’darkblue’)
plt.ylabel(‘Predicted Prices’, fontsize=12, color=’darkblue’)
plt.title(‘Actual vs. Predicted Prices’, fontsize=14, color=’darkgreen’, pad=20)
plt.legend(fontsize=10)
plt.grid(True, linestyle=’–‘, alpha=0.5)
plt.show()
2. Feature Engineering: Enhance your dataset by creating new features, such as the age of the house or proximity to amenities.
3. Try Advanced Algorithms: Experiment with models like Random Forests or Gradient Boosting for improved accuracy.
Explore : Understanding the Interquartile Range (IQR) for Better Data Analysis – Around Data Science
Conclusion for Prediction Model for House Prices
To summarize, here are the steps to build your first house price prediction model:
- Choose a dataset with relevant features and target variables.
- Preprocess the data by handling missing values, normalizing scales, and splitting into training/testing sets.
- Train a simple linear regression model using Scikit-Learn.
- Evaluate the model’s performance and visualize results.
By following this guide, you’ve not only created a functional model but also gained valuable insights into the machine learning process. Now it’s time to refine your skills and experiment with more complex datasets and algorithms.
Congratulations on completing your first prediction model for house prices! 🎉
Ready to Dive Deeper?
🌟Feeling curious about where to go next? There are tons of online resources and beginner-friendly courses available to help you delve deeper into the world of Data Science. So, we encourage you to explore more content on Around Data Science.
Subscribe to our newsletter to receive regular updates and be among the first to know about exciting new resources, like our first upcoming free eBook on “Al for People in a Hurry”! This comprehensive guide will demystify the world of AI and empower you to leverage its potential in your everyday life; whatever your role or background. Don’t miss out !
Welcome to a world where data reigns supreme, and together, we’ll unravel its intricate paths.


0 Comments