
In overfitting and underfitting, small modeling mistakes can silently destroy real-world performance, especially on local Algerian data where noise, scale, and scarcity are common.
This guide shows you how to see, measure, and fix both problems using simple visuals, intuition, and concrete Algerian-inspired datasets, so your models generalize, not just memorize.
TL;DR
- Overfitting = model memorizes training data, fails on new data.
- Underfitting = model too simple, misses patterns everywhere.
- The bias–variance tradeoff explains both.
- Visual diagnostics + cross-validation catch issues early.
- Regularization, data quality, and proper validation fix most cases.
What is overfitting and underfitting?
Overfitting and underfitting describe how well a model generalizes beyond the training set.
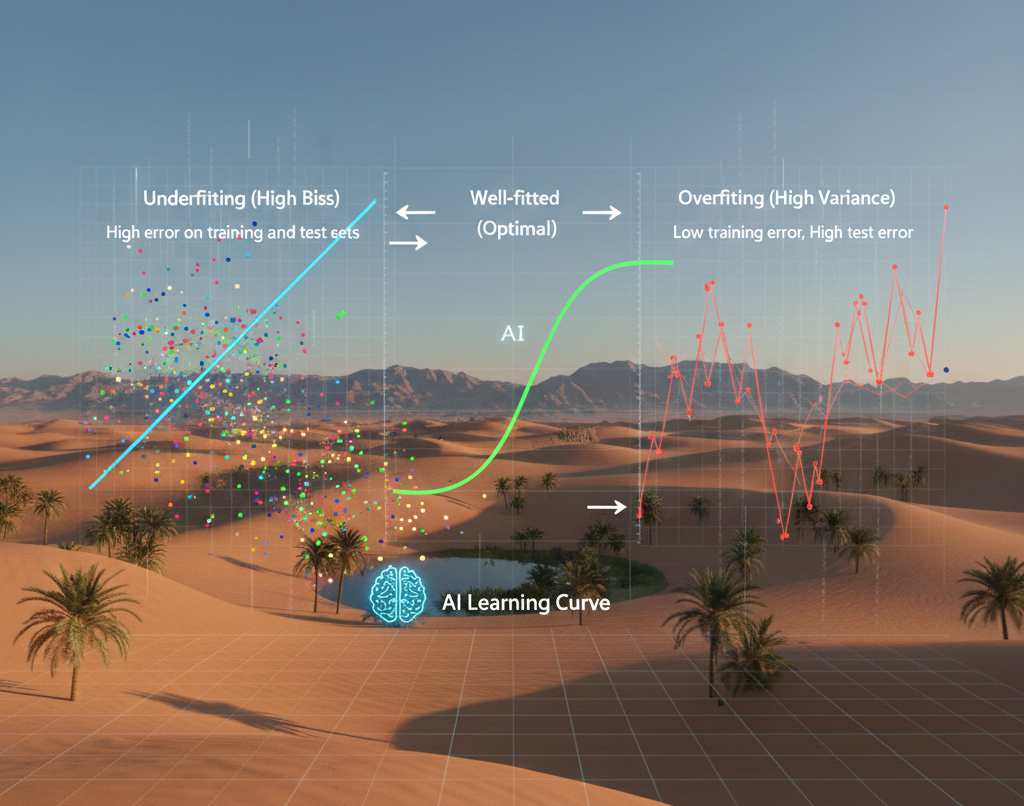
Underfitting (high bias)
A model is too simple to capture the true structure.
Symptoms
- High error on training and test sets
- Flat learning curves
- Oversimplified decision boundaries
Common causes
- Linear model for a non-linear problem
- Too few features
- Excessive regularization
Overfitting (high variance)
A model is too complex and learns noise.
Symptoms
- Very low training error
- High validation/test error
- Highly irregular decision boundaries
Common causes
- Too many parameters
- Small or noisy datasets
- Data leakage
More in depth : How to train, test & evaluate ML models step-by-step – Around Data Science
Why overfitting and underfitting matter in Algerian datasets
Algerian datasets often have:
- Limited samples (local surveys, academic projects)
- Seasonality (weather, energy consumption)
- Reporting noise (manual data collection)
These characteristics increase variance and amplify overfitting risk.
Typical Algerian use cases
- Electricity load forecasting (Sonelgaz-style time series)
- Rainfall prediction by wilaya
- Student performance prediction
- Telecom churn analysis
The bias–variance tradeoff explained visually
The bias–variance tradeoff explains why improving one often worsens the other.
| Model complexity | Bias | Variance | Risk |
|---|---|---|---|
| Too simple | High | Low | Underfitting |
| Balanced | Medium | Medium | Optimal |
| Too complex | Low | High | Overfitting |
Goal: minimize generalization error, not training error.
Visual intuition with a simple regression example
Imagine predicting daily electricity demand in Algiers.
- Underfitted model: straight line misses seasonal peaks
- Well-fitted model: smooth curve captures trends
- Overfitted model: jagged curve follows noise
import numpy as np
import matplotlib.pyplot as plt
from sklearn.preprocessing import PolynomialFeatures
from sklearn.linear_model import LinearRegression

np.random.seed(42)
X = np.linspace(0, 365, 120).reshape(-1, 1)
y = 0.01 * X.squeeze() + 2 * np.sin(X.squeeze()/30) + np.random.normal(0, 0.5, 120)

for degree in [1, 3, 15]:
    poly = PolynomialFeatures(degree)
    X_poly = poly.fit_transform(X)
    model = LinearRegression().fit(X_poly, y)
    y_pred = model.predict(X_poly)
    plt.plot(X, y_pred, label=f"degree {degree}")

plt.scatter(X, y, s=10)
plt.legend()
plt.title("Underfitting vs overfitting (Algiers energy example)")
plt.show()
Real Algerian dataset examples (practical scenarios)
Example 1: Rainfall prediction by wilaya
- Dataset: Monthly rainfall (ONS / meteorological stations)
- Risk: Overfitting due to few years of data
- Fix:
Example 2: Student performance prediction
- Dataset: University exam results
- Risk: Underfitting with linear models
- Fix:
- Add interaction features
- Tree-based models with depth control
Example 3: Telecom churn classification
- Dataset: Call usage + billing
- Risk: Severe overfitting with deep trees
- Fix:
- Pruning
- Cross-validation
- Regularization
How to detect overfitting and underfitting in practice
1. Train vs validation curves
from sklearn.model_selection import learning_curve
- Gap increasing → overfitting
- Both high → underfitting
2. Cross-validation scores
- Large variance across folds = instability
3. Feature importance sanity checks
- Many tiny features dominating = warning sign
How to fix overfitting and underfitting
To reduce underfitting
- Increase model complexity
- Add better features
- Reduce regularization
- Use non-linear models
To reduce overfitting
- Collect more data
- Use regularization (L1/L2, dropout)
- Early stopping
- Feature selection
- Cross-validation
Discover: An Excellent Machine Learning Pipeline : Don’t Search Out – Around Data Science
Using AI-driven platforms to reduce overfitting in production systems
In real-world environments, overfitting and underfitting don’t stop at model training. They often reappear after deployment, when data distributions shift or user behavior evolves. This is especially true for e-commerce, recommendation systems, and automated decision platforms.
Modern AI-powered platforms help mitigate these risks by:
- Continuously monitoring data drift
- Automating retraining pipelines
- Enforcing validation and performance checks
- Reducing human-induced data leakage
🔥 If you’re looking to build a high-performing online store while keeping things simple, check out Ayor.ai.
It’s an AI-powered e-commerce platform designed to help you launch, optimize, and scale your store — not only in Algeria but globally.
From automation to product optimization and AI assistants, Ayor.ai enables:
- Smarter decision-making from real user data
- Reduced overfitting through continuous optimization
- Faster experimentation without manual ML pipelines
Regularization methods (quick comparison)
| Method | Use case | Effect |
|---|---|---|
| L1 (Lasso) | Sparse features | Feature selection |
| L2 (Ridge) | Multicollinearity | Shrinks weights |
| ElasticNet | Mixed | Balanced |
| Dropout | Deep learning | Reduces co-adaptation |
Model selection checklist (engineer-friendly)
- Did you split data correctly?
- Is test data untouched?
- Are features leaking future info?
- Does the model make domain sense?
- Did you compare with a baseline?
7 bonus tips for overfitting and underfitting
- Always start with a baseline model
- Visualize predictions, not just metrics
- Prefer simpler models on small Algerian datasets
- Use time-aware splits for temporal data
- Monitor validation loss, not training loss
- Add noise-aware preprocessing
- Document assumptions and constraints
FAQ: overfitting and underfitting
What is the simplest definition of overfitting?
A model that performs well on training data but poorly on new data.
Can deep learning models underfit?
Yes. With poor architecture, features, or optimization.
Is more data always the solution to overfitting?
Often helpful, but not always sufficient.
How does cross-validation help?
It estimates generalization error more reliably.
Are ensemble models immune to overfitting?
No, but they often reduce variance.
Which metric best detects overfitting?
A growing gap between training and validation performance.
Conclusion for overfitting and underfitting
Overfitting and underfitting are not abstract theory problems. They are practical engineering risks, especially when working with real Algerian datasets that are small, noisy, or seasonal.
Summary
- Understand bias vs variance
- Use visuals and diagnostics
- Validate properly
- Favor simplicity when data is limited
- Apply regularization and cross-validation
The key to robust ML systems is mastering overfitting and underfitting.
👉 Join the Around Data Science community on Discord, subscribe to our newsletter, and follow us on LinkedIn.
Key Takeaways
- Overfitting memorizes; underfitting oversimplifies
- Bias–variance tradeoff guides model choice
- Visual checks are as important as metrics
- Algerian datasets require careful validation
- Practical fixes exist for both problems


0 Comments